Sunspot Observations
Spotless
Days on the Sun 2015 0
days 0% 2014 1
day <
1% 2013 0
days 0% 2012 0
days 0% 2011 2
days <
1% 2010 51
days 14% 2009 260
days 71% The active latitudes for Sunspots to appear were between 0 degrees and 10 degrees North of the Sun's equator. The majority of the total number of Sunspots observed for September 2015 appeared in the Northern Hemisphere between 0 degrees and 30 degrees. 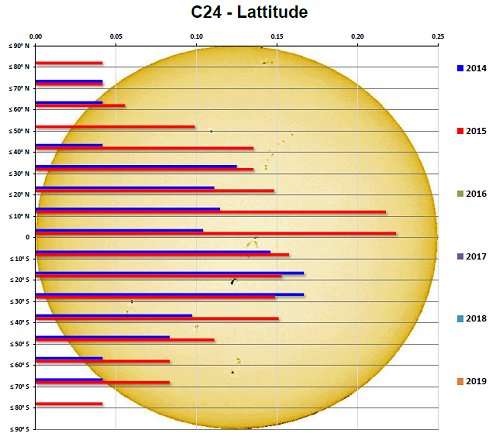
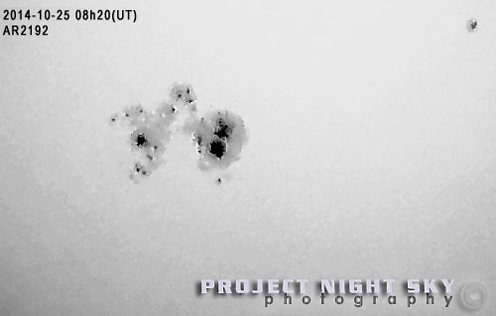
As seen in the image above, the main feature is a sunspot recorded as AR2192 and appeared around mid-late October 2014. This sunspot is the largest in 24 years, compared to AR6368 in November 1990. AR2192 is estimated at around 16 times the size of Earth.
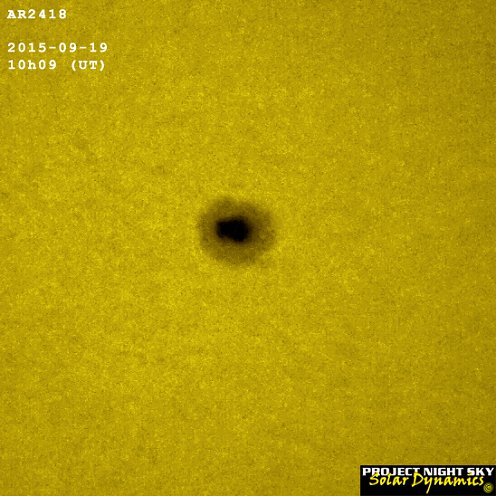
Sunspots range in size from the smallest observable objects to huge areas. Sunspots are cooler regions of the solar surface caused by intense localized magnetic fields that bring the upward convection of internal material to a virtual standstill.
Sunspots come in a wide variety of shapes
and sizes. While the simplest sunspots are isolated dark areas, larger
spots are quite dramatic. Complex spots feature a dark central region
called the umbra surrounded by a gray penumbra.
WARNING: NEVER LOOK DIRECTLY AT THE SUN, OR THROUGH ANY APPARATUS WHICH HAS NOT BEEN FITTED WITH A PROPPER SOLAR FILTER! |
Other PhenomenonThe Amateur's Guide to Sunspot ObservationsDownload NOW available
Click on the above to download The Amateur's Guide to Sunspot Observations (PDF) SUN HALO
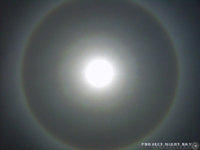
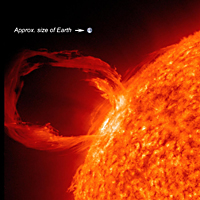
Sun Halos are a sign of high thin Cirrus Clouds drifting 20,000 feet or more above our heads. Scientifically these halos are called "22 Degree Halos" because the two reflections bend the light by 22 degrees from its original direction. This means that the halo can be seen when your eyes make a 22 degree angle with the Sun. The ring is caused by sunlight passing through the ice crystals in Cirrus Clouds (containing millions of tiny ice crystals) within the Earth's atmosphere. The crystals bend direct sunlight, projecting at 22 degrees. PROMINENCES & FLARESProminences are dense clouds of material that are associated with active regions are characteristically short-lived. They often appear as closed loops or as violent ejections of matter in sprays and surges. A filament is the
same as a prominence, except that whereas prominences are seen outside the
Sun's disc, filaments are seen against the disc. Image
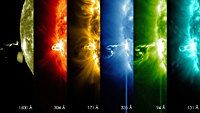
Credit: SDO/NASA Goddard's Scientific Visualization Studio Flares are a sudden release of the Sun's energy. They can have an effect on Earth in that it can break up radio communications and cell-phone calls. They begin with a sudden brightening, usually near sunspots, and increase to maximum brightness in 5 to 10 minutes. During this time the solar flare spreads to surrounding areas. The most favorable times for flares to occur are when sunspot groups are decaying or growing. SOLAR CYCLE
Sunspot activity varies over an 11-year period - called a Solar Cycle, or also referref to as a Sunspot Cycle. The increase and decrease of sunspots is averaged over 11 years, although some cycles can be as short as 8 years and other even as long as 13 years. A solar cycle has a Solar Maximum and Solar Minimum. During Solar Max the Sun is bustling with action. The increase of solar flares and CME's (Coronal Mass Ejections) can cause disruption to various types of electronic equipment, both in Space and on Earth. Solar Min is the opposite of Solar Max, when things are quiter on the Sun, but this is not to say that nothing happens as Solar activity never stops. | ||||||||||||||||||||||||
 Data
provided by Project Night Sky Solar Dynamics - September 2015
Data
provided by Project Night Sky Solar Dynamics - September 2015